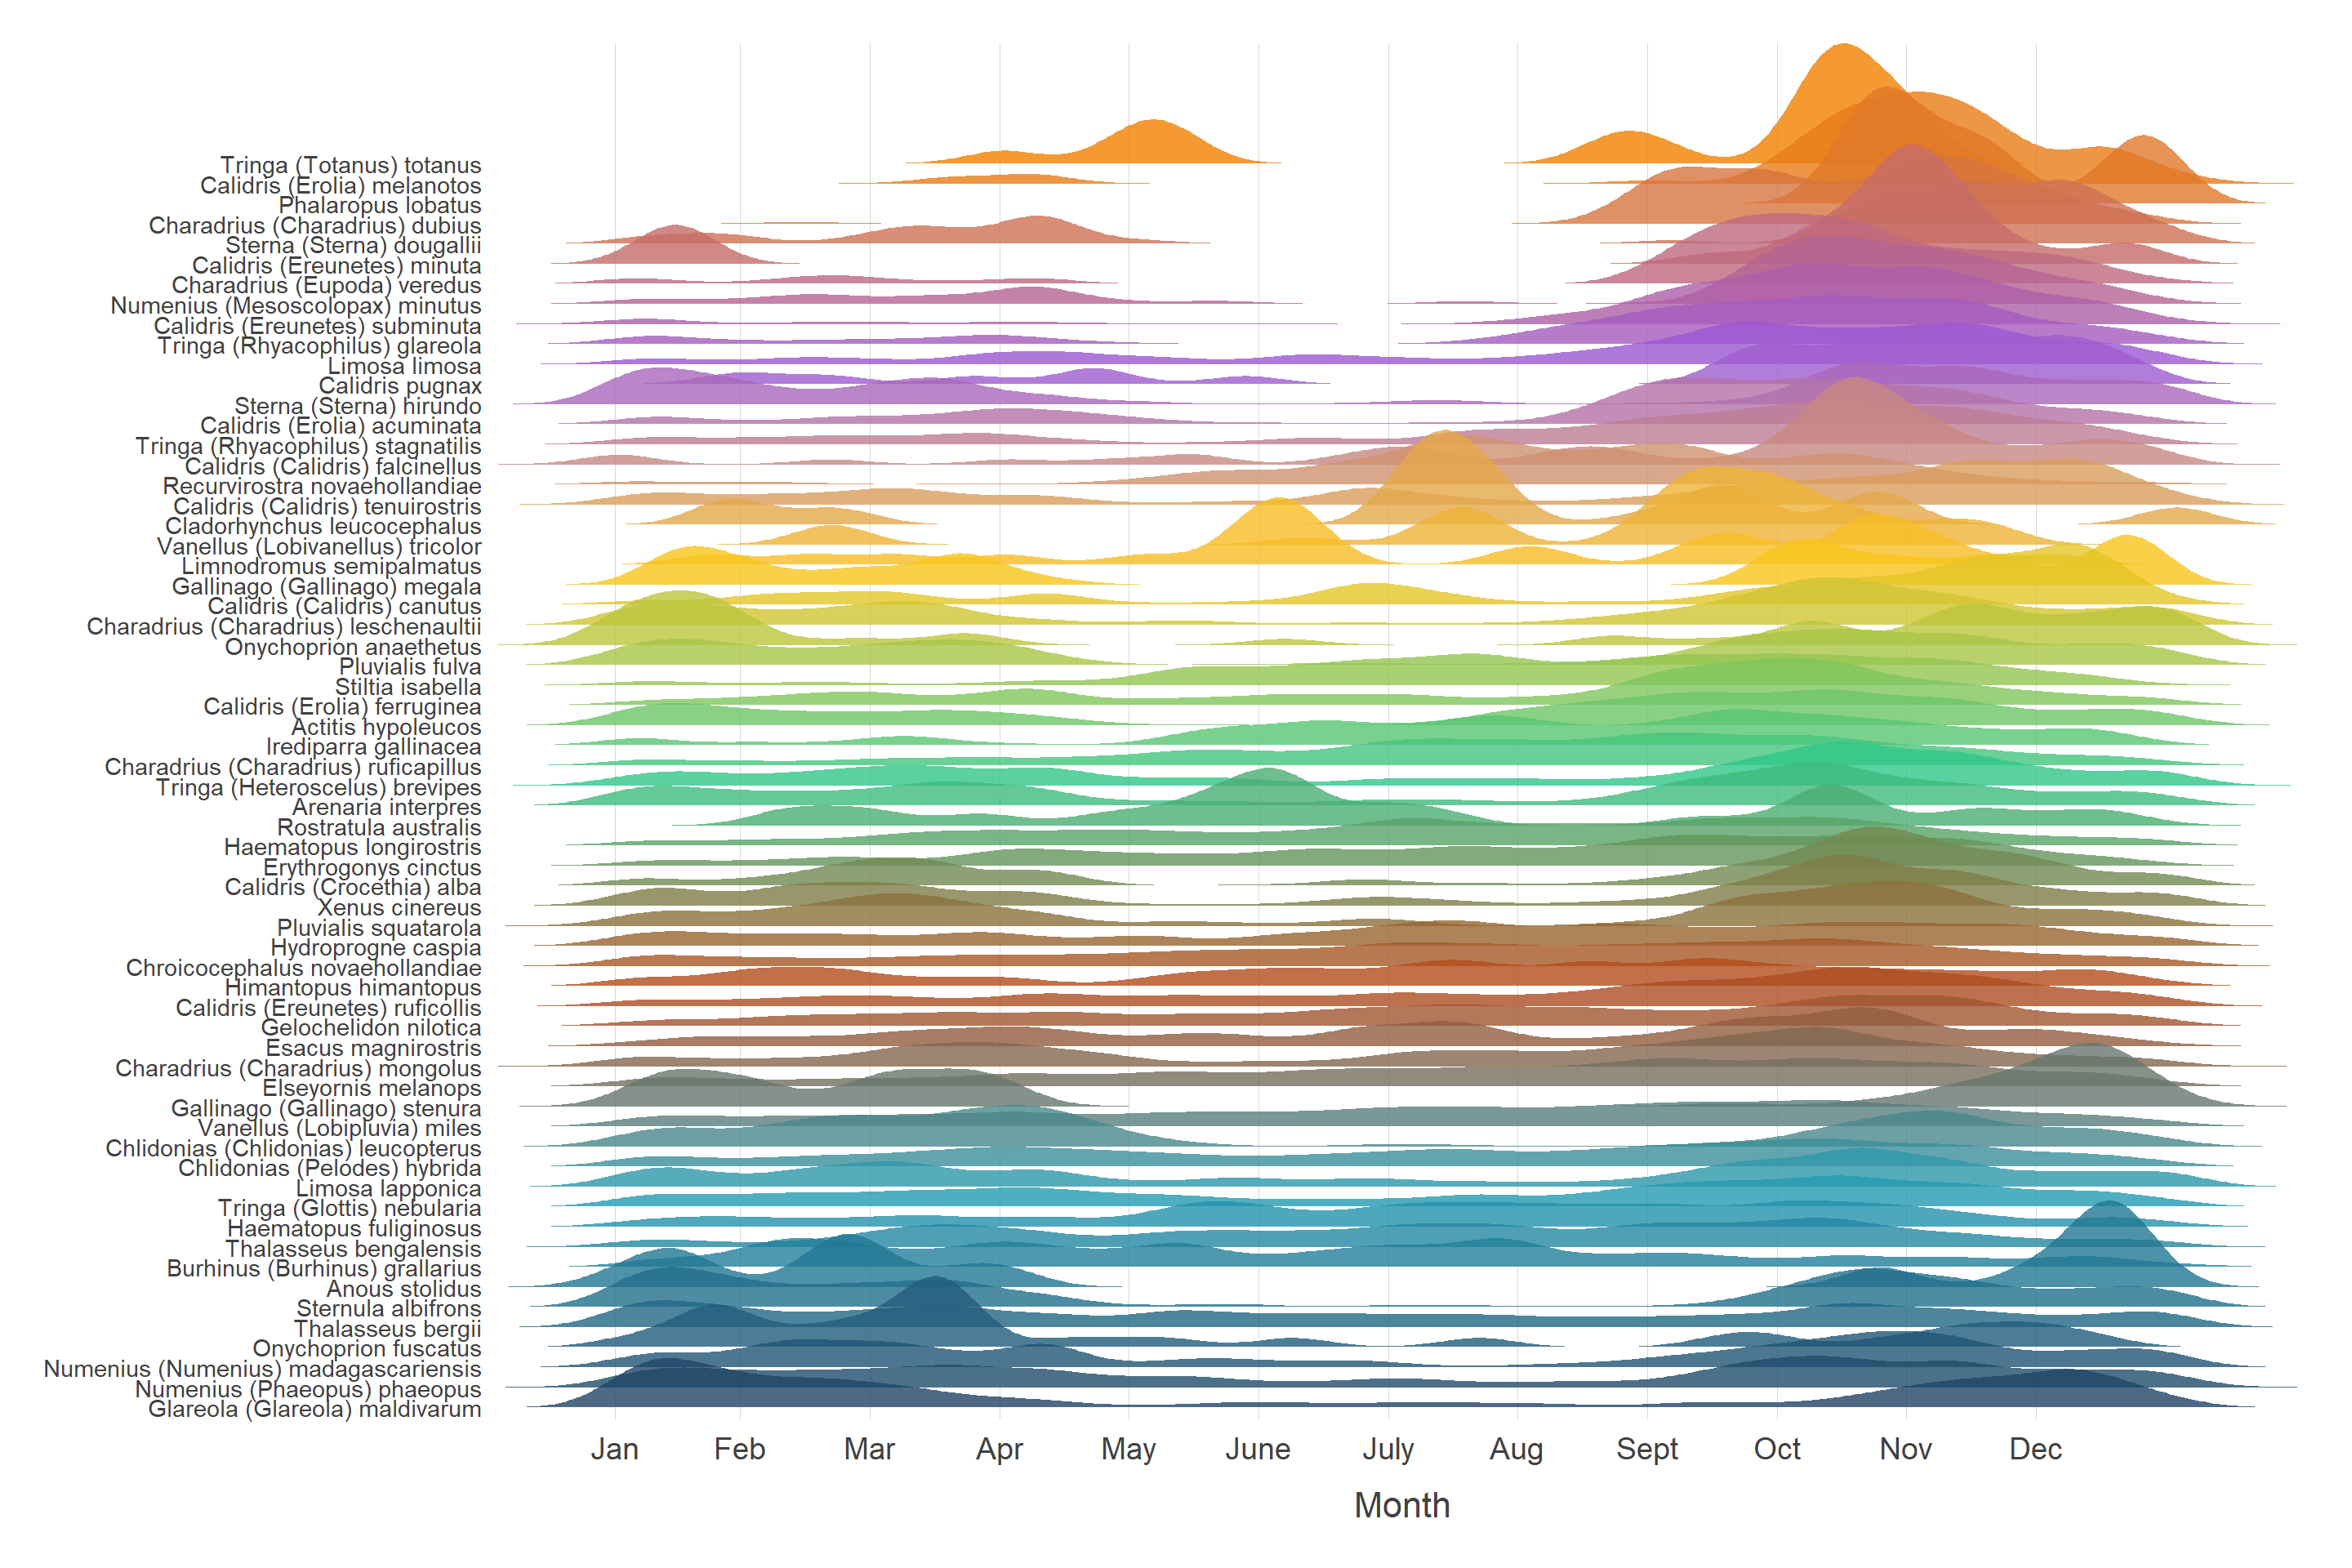
Show seasonal species trends using a ridgeline plot
Post for ALA Labs
May 2024
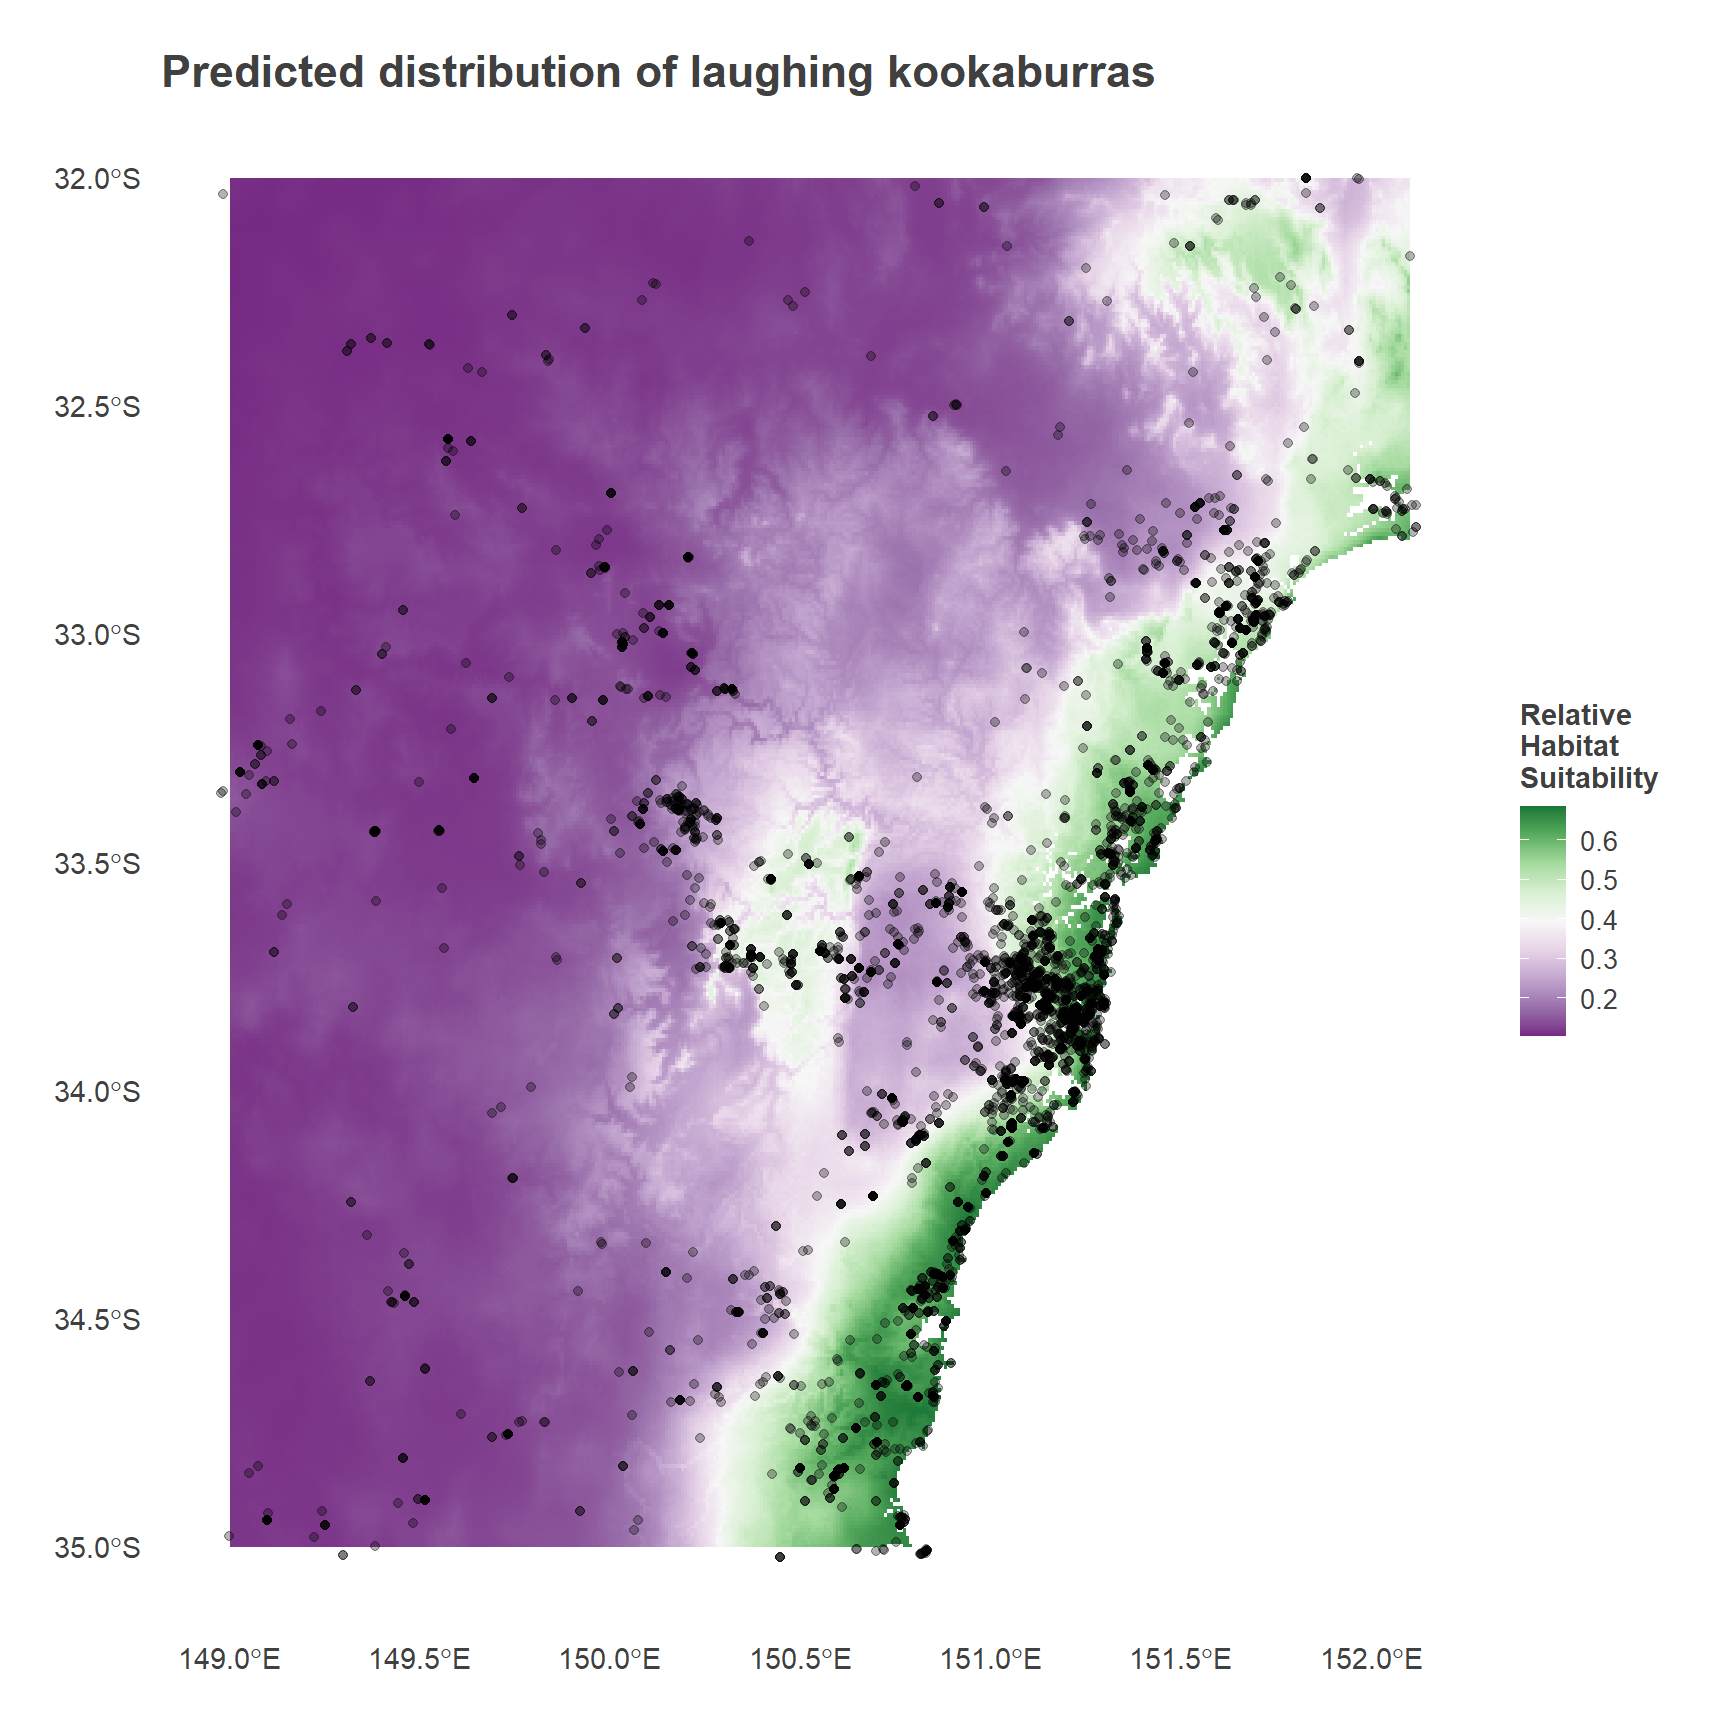
An introduction to species distribution modelling using {tidysdm} & {tidymodels}
Post for ALA Labs
April 2024
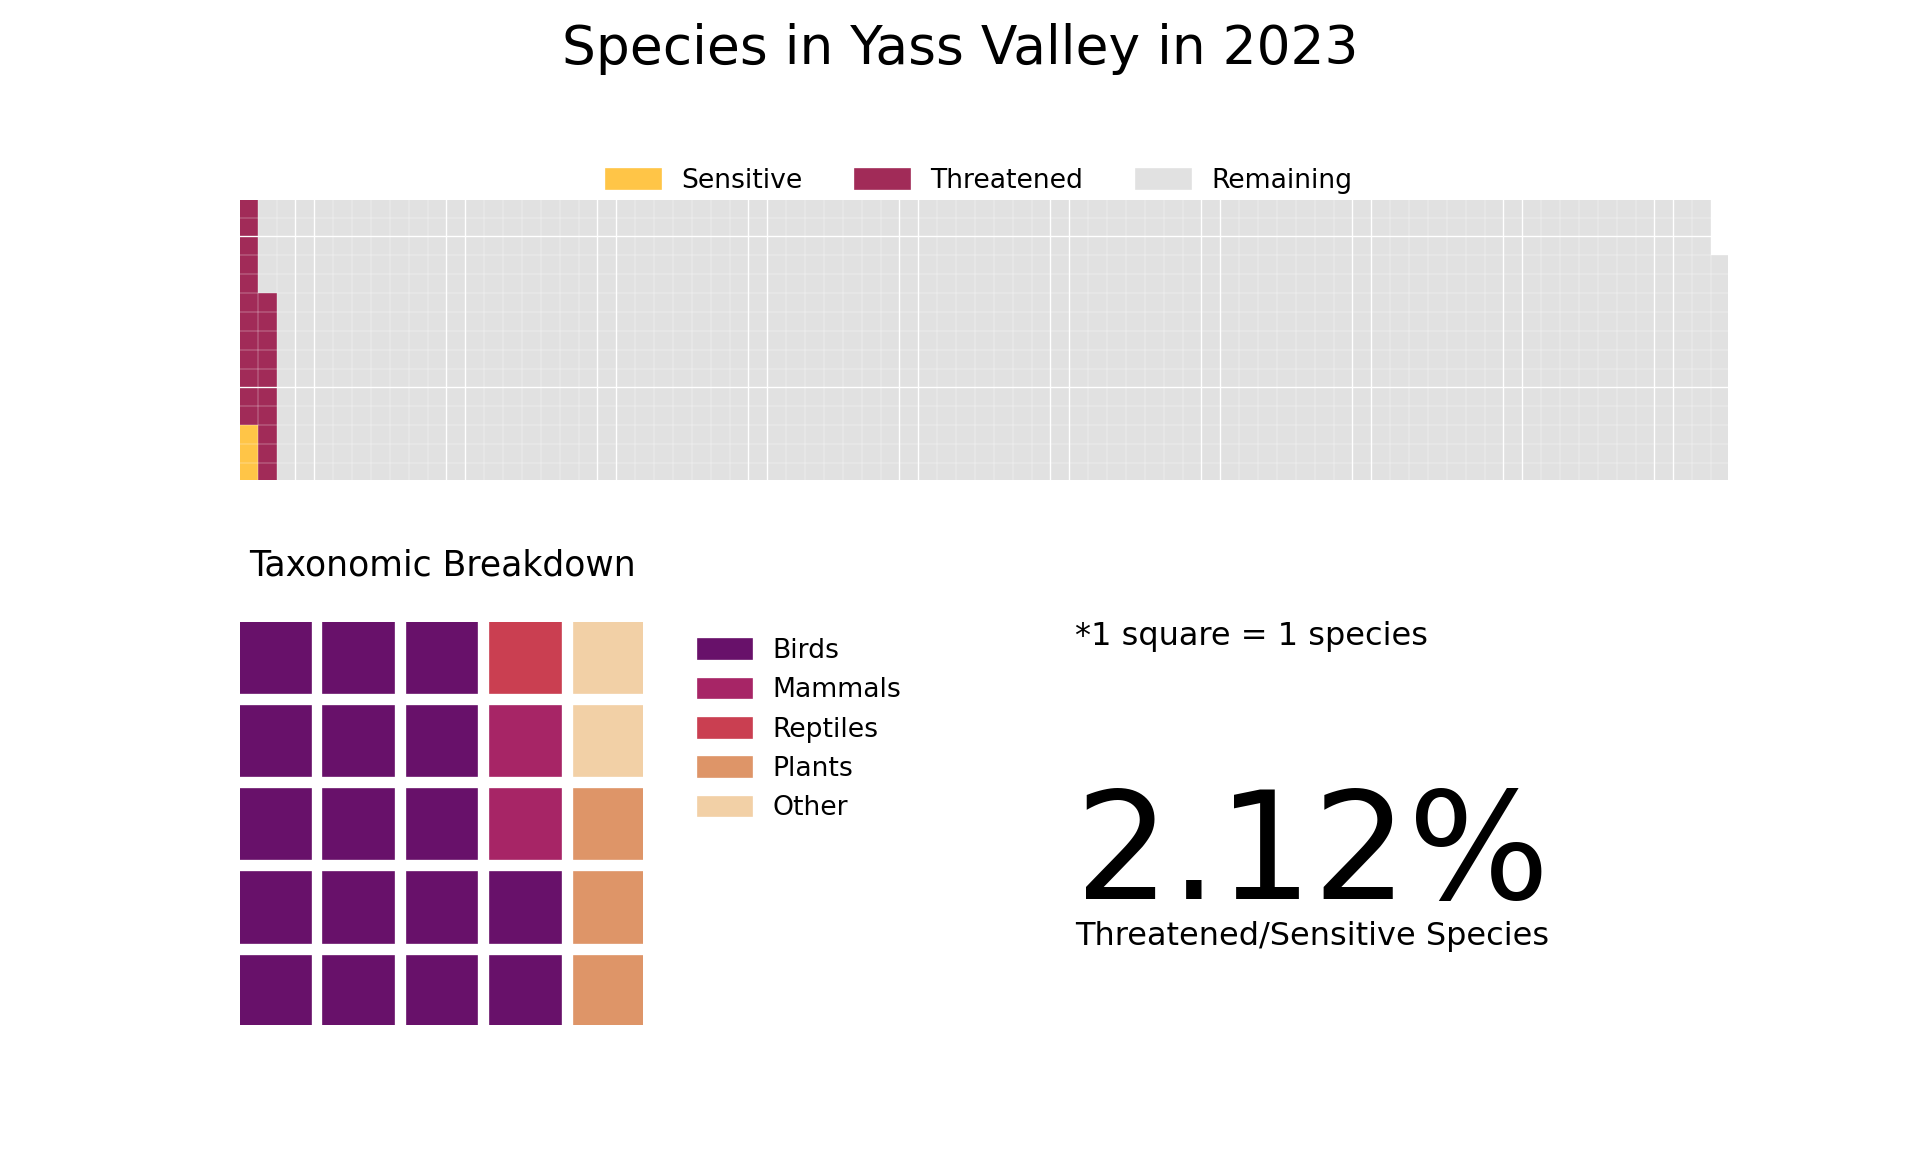
Download a species list and cross-reference with conservation status lists
Post for ALA Labs
February 2024
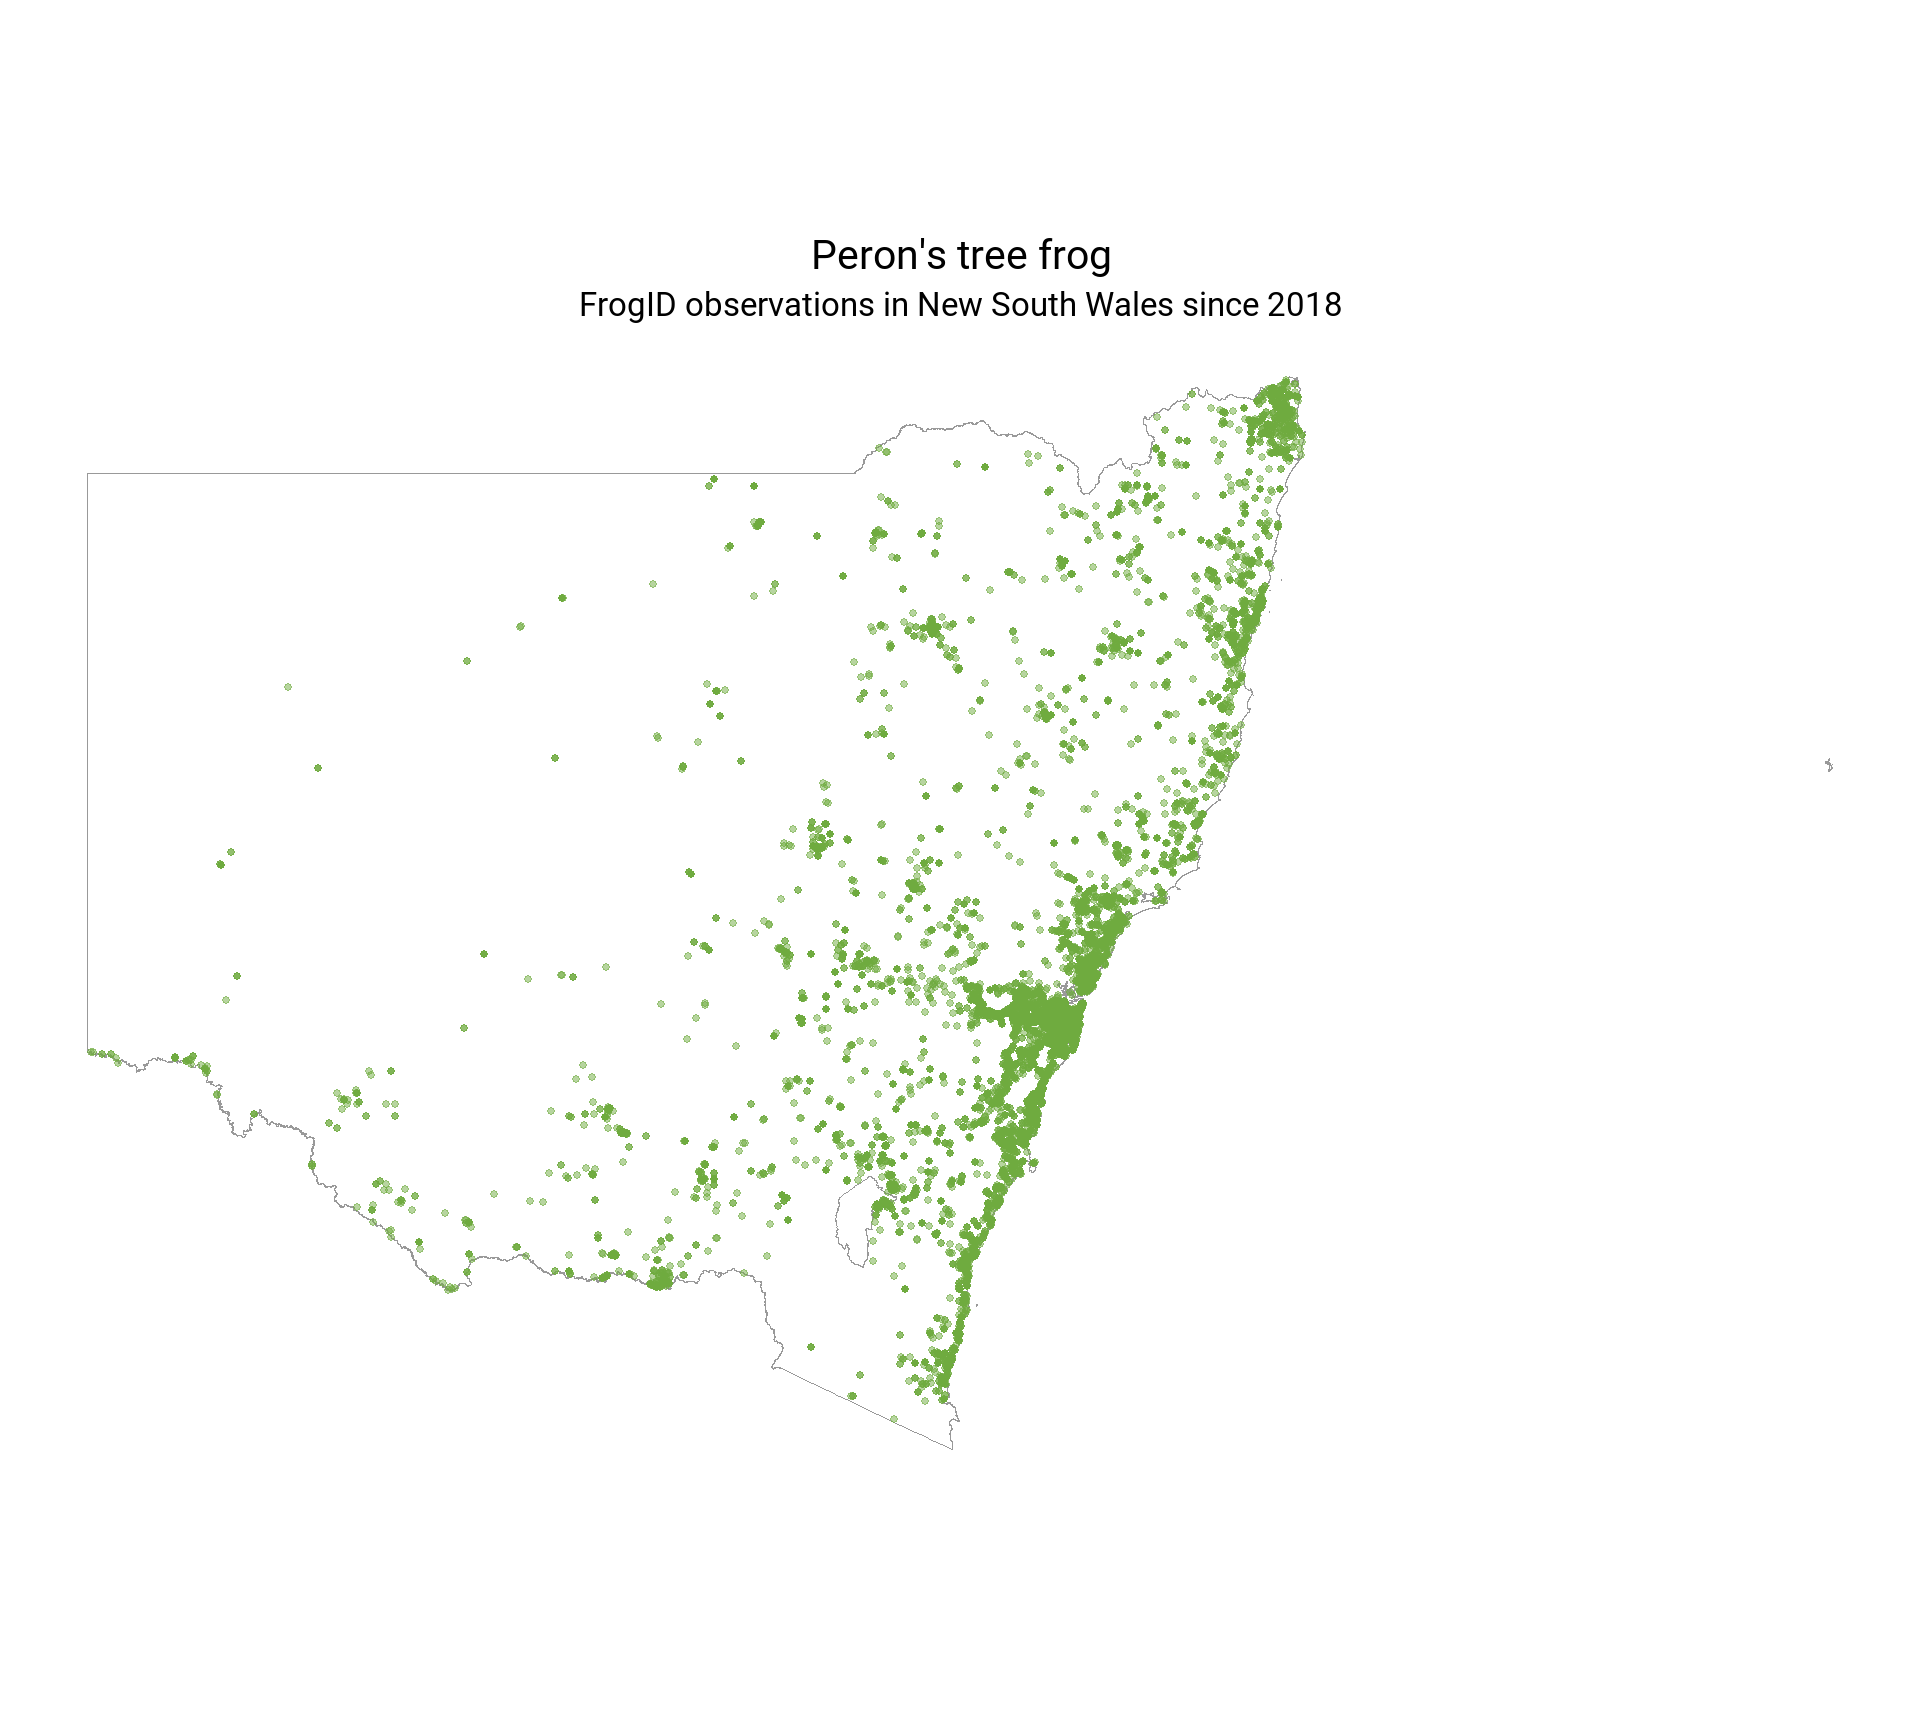
Beginner’s guide: Make a quick map of species observations in Python and R
Post for ALA Labs
December 2023
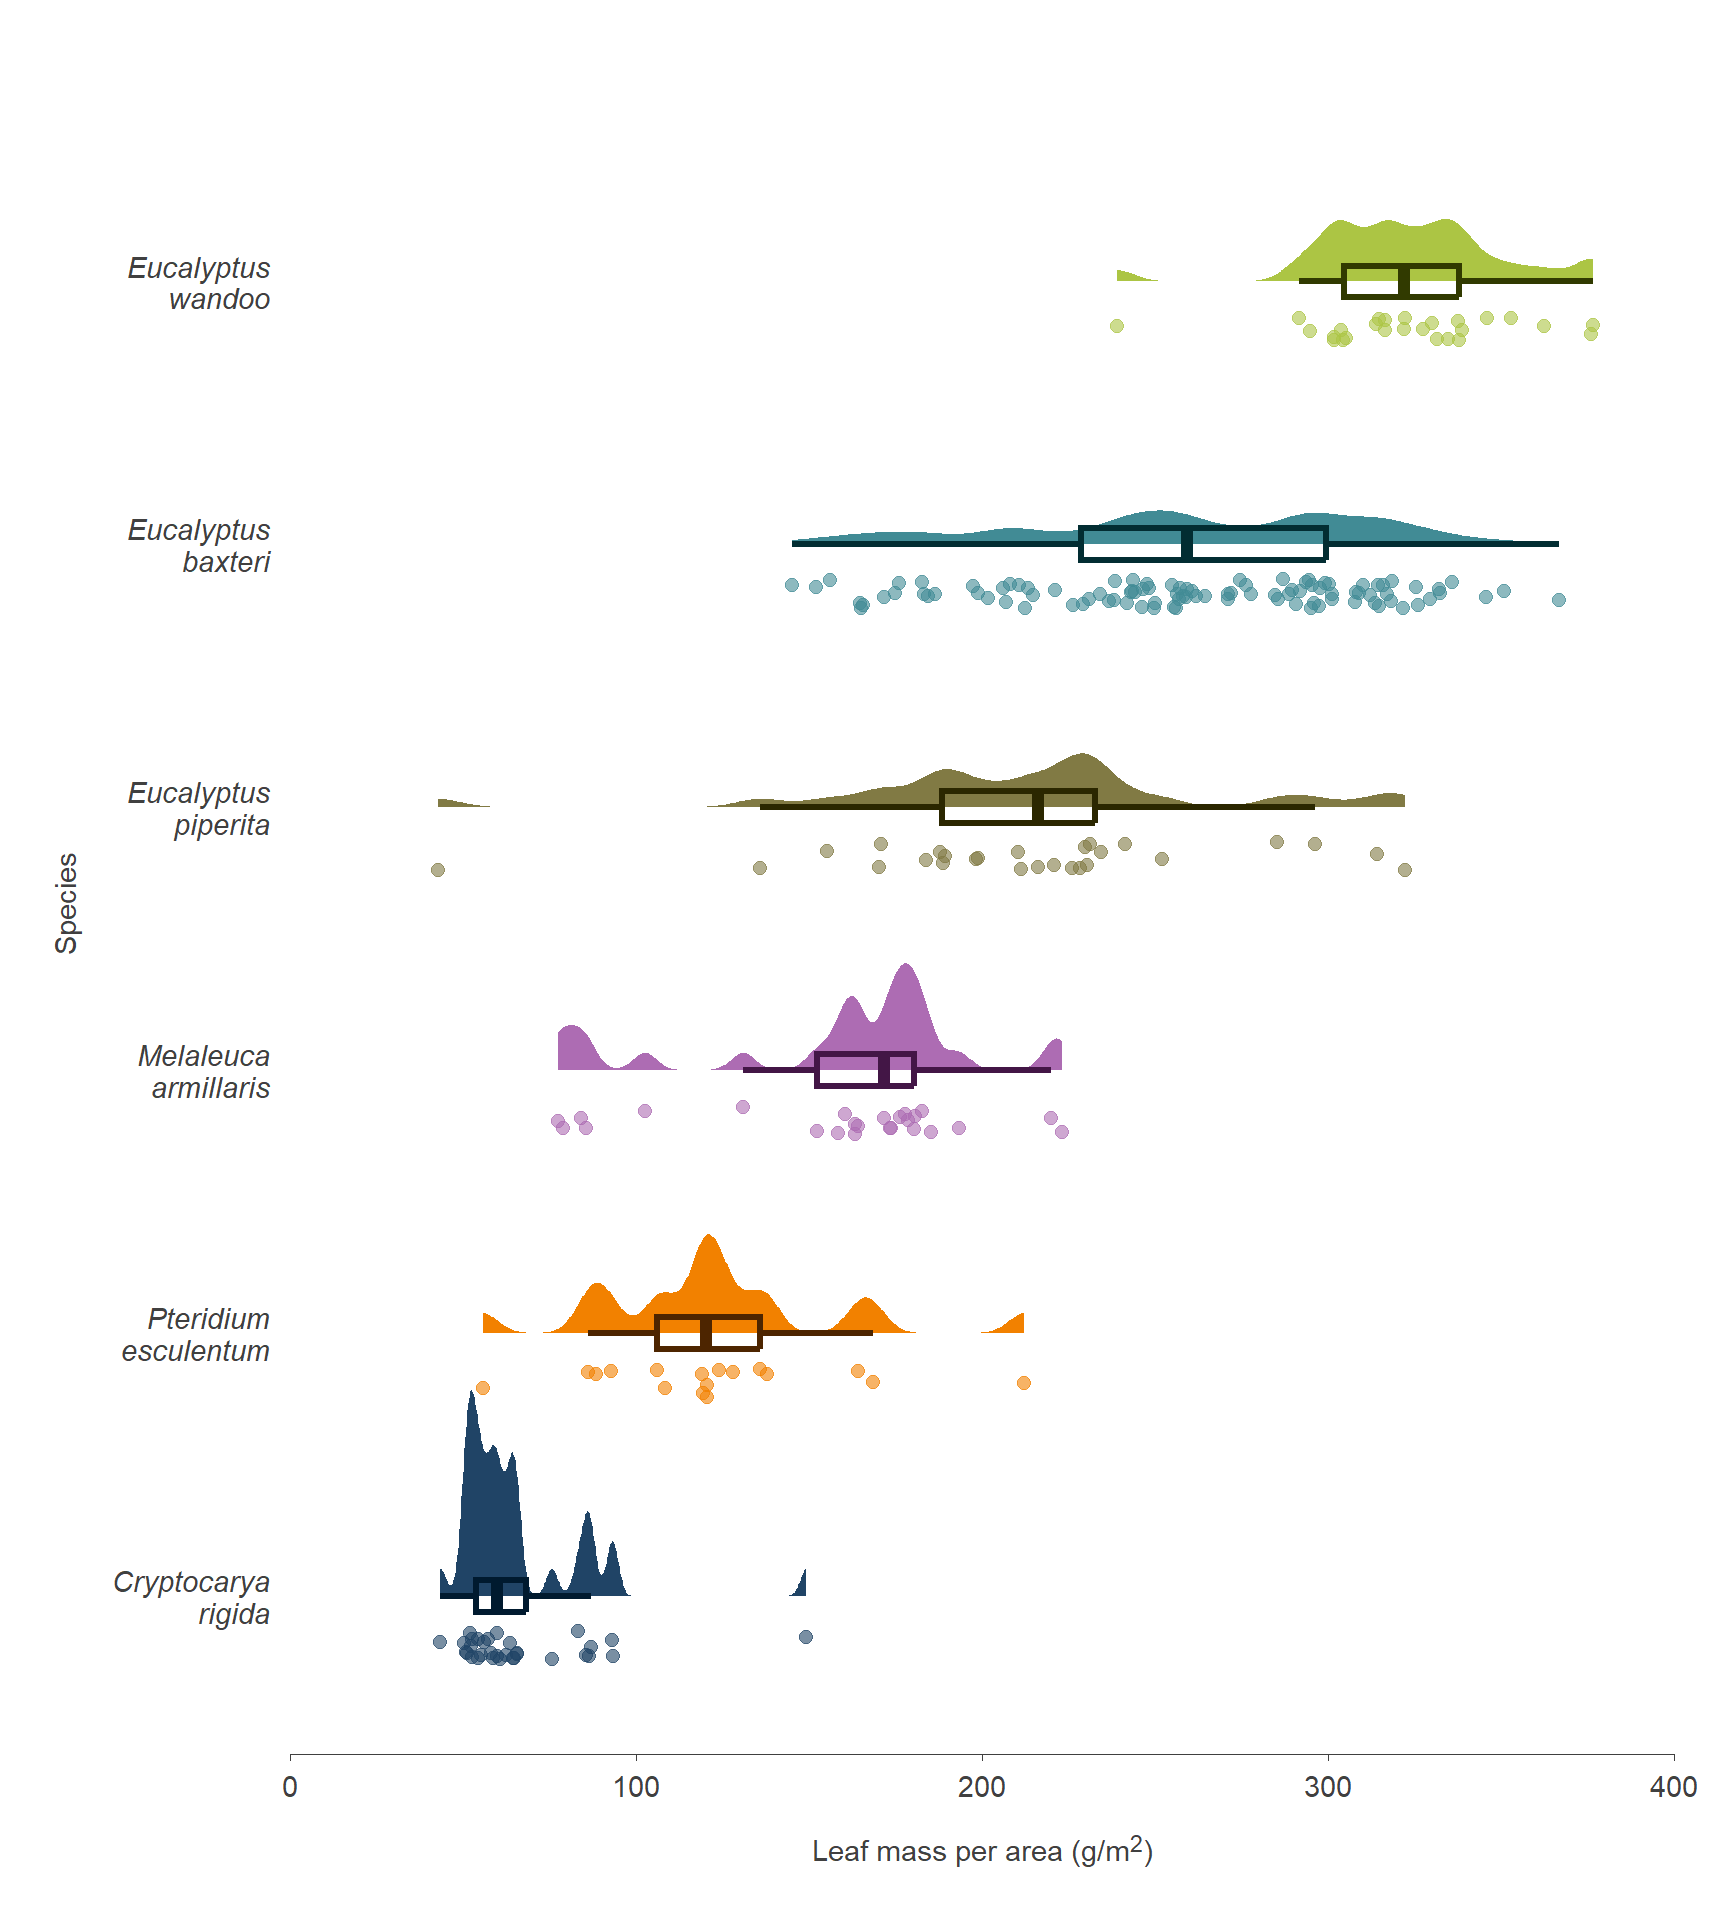
Alternatives to box plots: Using beeswarm and raincloud plots to summarise ecological data}
Post for ALA Labs
August 2023

Quantify geographic sampling bias with {sampbias}
Post for ALA Labs
August 2022

Download plant species data by hexagon to make a 3D hex map
Post for ALA Labs
May 2022